Neighborhood incident data your legal team will sign off on.

The scores and cited event facts behind the SafeZone Map, as a structured, PII-free REST API. 15 countries, 21,000+ neighborhoods — without scraping, without building a news pipeline, and without accidental safety verdicts.

How scoring works
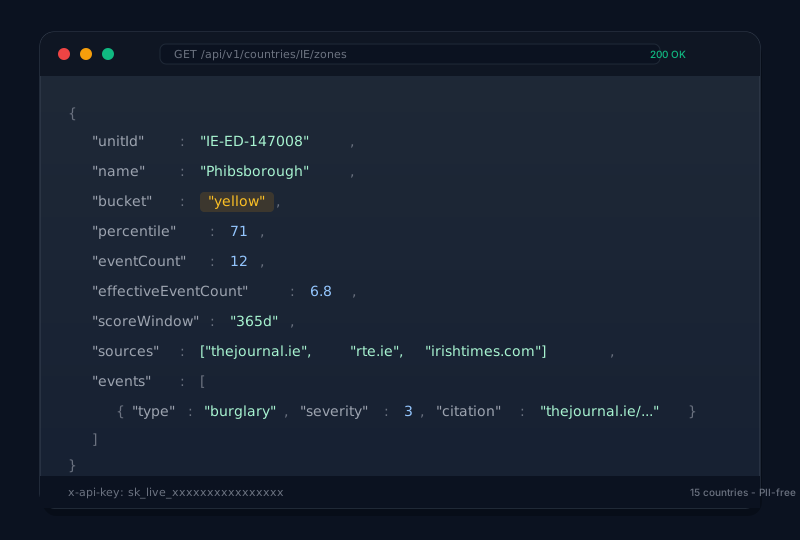
Sample Data API response: a zone object with bucket, percentile, eventCount, effectiveEventCount, and source citations.
15countries
21,000+units scored
PII-freeby construction
Keyedper-country or global

Why teams license it

Percentiles, not raw counts

Population-normalized and ranked against comparable areas — "red" always means "highest relative to peers," a framing that survives legal and PR scrutiny.

Evidence you can discount

An incident with vague geography is spread across every zone it might belong to. eventCount credits it to each whole; effectiveEventCount reports the fraction actually attributed. Null means not measured, never zero.

Honest uncertainty

Zones without sufficient data are explicitly "insufficient data." Your product never tells a customer an unmeasured area is safe.

Every score traceable

Event records carry crime type, severity, dates, and a citation URL to the original publisher or official dataset. No black box.

PII-free by construction

No names, no article text, no personal data — raw text is discarded at extraction. Clean for GDPR-sensitive integrations.

Fresh

News ingestion runs hourly across all countries; scores refresh daily with a rolling window and recency decay.

Coverage on request

15 countries today. New markets are configuration, not engineering — ask about your geography.
Endpoints

JSON over HTTPS, authenticated with an x-api-key header. Keys are per-customer, optionally country-scoped, with daily rate limits.

Endpoint Returns
GET /api/v1/countries Coverage list with unit counts and unit types
GET /api/v1/countries/{code}/zones Paginated zone scores: bucket, percentile, eventCount, effectiveEventCount, scoring window, cohort
GET /api/v1/zones/{unitId} Current score plus score history
GET /api/v1/zones/{unitId}/events Cited event facts — type, severity, dates, source URL (up to 100 per zone)
A sample Data API response: a zone object with bucket, percentile, eventCount, effectiveEventCount, source list, and one cited event.

Coverage

Unit granularity matches each country's official statistical geography — Electoral Divisions, LSOAs, counties, communes, arrondissements. 15 countries today, and adding a market is a manifest change rather than a rebuild.

🇮🇪 Ireland 🇬🇧 United Kingdom 🇺🇸 United States 🇨🇦 Canada 🇫🇷 France 🇩🇪 Germany 🇪🇸 Spain 🇳🇱 Netherlands 🇸🇪 Sweden 🇳🇴 Norway 🇩🇰 Denmark 🇧🇪 Belgium 🇦🇹 Austria 🇱🇺 Luxembourg 🇬🇧 Northern Ireland

Who it's for

Proptech and listings portals

Area context on every listing page, with citations instead of vibes.

Insurers

A defensible, explainable relative-incident signal at neighborhood granularity.

Relocation and travel-safety

Multi-country coverage from a single integration.

Newsrooms

Ranked, cited, population-normalized data for local reporting.

Embed the map

A read-only map for your own page — one iframe, no API key, no cookies, no analytics. It shows the same ratings as the full map, keeps "insufficient data" as its own colour rather than a safety claim, and links back to the view it is showing.

License terms

Per country or globally, annual contracts, usage-tiered. Evaluation keys available — tell us your use case and we'll set one up.